Invest Now Schedule a 30-min call
Scroll or use ↑ ↓ to navigate
Proactive Sustainable BondsTM

Proactive Sustainable BondsTM are a real estate-backed, fixed-income-based, impact investments.

Our fund is designed to generate current income while supporting affordable and workforce housing preservation.

$26.5M1Assets under management
1,0122Units across the portfolio
9%–15%3Annual interest
1. Based on a combination of third-party appraisals and management estimates.
2. Based on current portfolio and representing manufactured homes, multifamily units, and Single-Room Occupancy (SRO) & workforce housing.
3. Range based on bond tier selected.
Impact Verified By Morningstar Sustainalytics UN PRI Impact Evaluation Lab BlueMark
Rule 506(c) — Institutional Investors Only
Scan for live deck
Impact-First. Fixed-Income.
Third-Party Verified. Real Estate-Backed.
www.sustainablebonds.com invest@sustainablebonds.com  |  +1 (206) 686-9293
Managed by The Proactive Realty Group, LLC
Rule 506(c) — Accredited Investors Only
Legal

Important Disclosures

This presentation is for informational purposes only and does not constitute an offer to sell or a solicitation of an offer to buy any security; any such offer may be made only by means of the Fund's confidential Private Placement Memorandum, Operating Agreement, and subscription documents.

The interests described are offered in reliance on Rule 506(c) of Regulation D under the Securities Act of 1933 and are available only to "accredited investors" as defined in Rule 501(a); the issuer will take reasonable steps to verify accredited investor status before accepting any subscription.

The securities are unregistered, speculative, illiquid, and involve a high degree of risk; investors should be able to bear the economic risk of an indefinite investment and a possible complete loss of capital.

Investors are purchasing interests in a private fund, not direct interests in any specific real estate asset, and any collateral or security interests in underlying assets may not be sufficient to avoid losses.

Past performance is not indicative, predictive, or a guarantee of future results. Any targets, projections, or forward-looking statements are illustrative only, based on assumptions that may not prove accurate; actual results may differ materially.

Any performance, return, or valuation information presented may include estimated, unaudited, modeled, or hypothetical results and/or third-party data, each subject to inherent limitations and revision.

This material is intended solely for use by registered investment advisers and other institutional or professional intermediaries and is not intended for distribution to retail investors except as permitted by applicable law.

The interests described are not bank deposits or obligations of, or guaranteed by, any bank, and are not insured by the FDIC, the SIPC, or any other governmental or private insurance program.

See PPM for full legal disclosures.

03
The Proactive Realty Income Fund II, LLC

Above Market-Rate Returns.
Impact-First. Third-Party Verified.

An impact-first, fixed-income platform designed to deliver stable above-market-rate returns while advancing meaningful social and environmental outcomes through disciplined real-asset investing.

Capital Positioning
  • Backed by real assets — Naturally Occurring Affordable Housing (NOAH) properties
  • Priority repayment ahead of Sponsor equity
Underwriting Metrics

Current LTV: <65%

Current Debt Service Coverage Ratio (DSCR): 1.52x

Stabilized / Pro Forma: 3.25

Vetted by Multiple Impact Partners
Morningstar Sustainalytics UN PRI Impact Evaluation Lab BlueMark
↗ Access Impact Reports, IMM Framework & Scoring
Due Diligence report available upon request (centarusps.net).
04
Market Thesis

A Structural Imbalance in
Low-Income Workforce U.S. Housing

Capitalizing on housing dislocation across Naturally Occurring Affordable Housing (NOAH), such as manufactured, multifamily, and SRO / workforce units

4 to 6 Million
National Housing Unit Shortage

The Dislocation

Costs of housing and household formation are rising faster than wages.

The Solution

Manufactured housing and distressed multifamily properties carry a far lower land and materials cost basis to support housing.

The Advantage

Provide naturally occurring affordable housing at 20%–30% below market rents while offering attractive, predictable cash-flow returns for investors.

Affordable housing community
05
Our Strategy

The Proactive Flywheel

A self-reinforcing cycle — every turn compounds financial returns and social impact.

STAGE 01
Deploy
Acquire and renovate under-stabilized affordable housing with investor capital.
STAGE 02
Improve
Lease-up campaigns and operational upgrades push occupancy and NOI higher.
STAGE 04
Refinance
As a property stabilizes, the Fund intends to pursue refinancing where lender underwriting supports the transaction. Available net refinance proceeds may be used to satisfy senior property-level obligations and return investor principal in accordance with the Notes, PPM, and Security Documents.
STAGE 03
Cash Flow
Stabilized communities pay steady, recurring quarterly distributions.
Per Turn Each cycle is designed to increase NOI, improve DSCR, support an underwritten refinance path, and create potential liquidity for investor principal repayment in accordance with the Notes and PPM. As properties stabilize, the Fund may seek refinancing at an LTV above 65% where stabilized value, NOI, DSCR, lender underwriting, and market conditions support that level of proceeds. Refinancing and return of capital are objectives and are not guaranteed.
06
Our Underwriting

Impact-First Underwriting & Return of Capital

We look for affordable/workforce housing where the impact is direct, the property can produce income, and the refinance path is visible before capital is deployed.

Screen
~15 opportunities
Select
1–2 deals advance
Deploy
Committee + DD cleared
What Must Be True Before We Buy
1. Market need. Is there a housing shortage and workforce housing need?
2. Impact fit. Does the deal directly advance SDGs 1, 3, 5, 6, 7, 10, 11?
3. Affordability. Can rents remain at least 20% below local market rate?
4. Income viability. Does it have income, or a credible path to occupancy, NOI and cash flow?
5. Diligence + returns. Do DSCR, collateral, committees and third-party DD support moving forward?
The Value Creation CycleCurrent income → capital deployment → higher occupancy & NOI → stronger DSCR → higher value → refinance → return of capital.
What Capital Does
The portfolio already has current income. New capital expands income by activating units, improving operations and reducing senior-debt pressure.
How Stabilization and Refinancing Support Return of Capital
1. Stabilize. Improve occupancy, recurring revenue, NOI, DSCR, and collateral value.
2. Refinance. Once lender thresholds are met, the Fund may refinance a stabilized property at an LTV above 65% where lender underwriting supports that leverage and sufficient proceeds.
3. Repay. Refinance proceeds are expected to first satisfy property-level mortgage debt and other senior obligations where applicable. Available net proceeds may then be used to repay investor principal and accrued amounts in accordance with the Notes, PPM, and Security Documents.
Refinancing is an intended repayment pathway and may not occur on expected terms or at all.
07
Our Underwriting

The How: Income → Refinance → Return of Capital

We focus on owned / controlled portfolio assets that already produce rental income. New capital is targeted where it can activate units, improve operations, expand NOI, and create the refinance path to return investor principal.

1 Current Income
Portfolio assets already produce rent.
2 Capital Expands NOI
Activate units + fix infrastructure.
3 Refinance Returns Capital
Stabilized NOI supports refi.
Current Portfolio
  • Current income exists today.
  • The immediate focus is not buying more parks.
  • Capital is deployed where vacancies, deferred work, or operations can be converted into more recurring NOI.
  • Not every property has mortgage debt.
Underwriting Filter
  • Housing shortage + workforce demand.
  • SDG fit: 1, 3, 5, 6, 7, 10, 11.
  • Rents at least 20% below market.
  • Existing income or a credible path to NOI / DSCR.
  • Investment Committee, Impact Committee, and third-party DD approval.
Return of Capital
  • Stabilize occupancy, operations, and NOI.
  • Improve DSCR and collateral value.
  • A stabilized asset may refinance above 65% LTV where lender underwriting supports it.
  • Senior property-level obligations are satisfied first; available net proceeds may repay investor principal under the Notes and PPM.
Refinance and repayment. Once lender underwriting thresholds are met, the Fund may refinance a stabilized property at an LTV above 65% where lender-supported value, NOI, DSCR, and market conditions permit. The refinance is intended to replace shorter-term bridge or investor capital with longer-term financing. Refinance proceeds are expected to first satisfy property-level mortgage debt and other senior obligations where applicable, and available net proceeds may then be used to return investor principal and accrued amounts in accordance with the Notes, PPM, and Security Documents.
Two LTV measures. Current portfolio LTV and refinance LTV are different measures. The portfolio may currently operate below 65% LTV while an individual stabilized asset may later qualify for a refinance above 65% LTV to create liquidity for investor repayment.
07
Capital Deployment

Typical Use of Proceeds

Investor capitalUnderwritten deploymentIncome, collateral & repayment capacity

Financing and reserves

Reduce or refinance higher-cost or shorter-term senior obligations; maintain debt-service, operating, capital-expenditure, and contingency reserves.

Stabilize properties

Renovations, unit activation, infrastructure, utilities, code compliance, and property stabilization.

Manufactured housing

Qualifying ENERGY STAR certified homes for Fund-owned communities, with applicable certification documented.

Water infrastructure

Sewer and wastewater systems, water lines and meters, leak detection, drainage, stormwater, and AI-enabled monitoring where appropriate.

Multifamily and SRO

Efficient windows, doors, roofing, insulation, HVAC, LED lighting, appliances, water-conserving fixtures, and LEED-informed renovations where appropriate.

Renewable energy

Solar and other renewable-energy improvements where technically feasible and economically appropriate.

Income investments

PPM-permitted first-lien and income-producing strategies, including real-estate debt, private credit, mortgage or trust-deed investments, preferred interests, notes, bonds, and Fund-of-Funds allocations.

Capital objective

Increase recurring income, NOI and DSCR; strengthen collateral value; lower operating or financing costs; support contractual payments and return of principal.

Capital is deployed subject to the PPM, final underwriting, and investment risks. Sustainability measures are applied where suitable and documented.

The Fund’s Sustainable Use of Proceeds Framework seeks to allocate capital toward affordable housing preservation, resource-efficiency improvements, water infrastructure modernization, renewable-energy opportunities, and qualifying income-producing investments that support sustainability objectives and resident affordability.

09
Portfolio Sustainability

Sustainability Embedded in the Portfolio

Sustainability is embedded in how we acquire, renovate, operate, and finance the portfolio. Property-level improvements are intended to reduce resource consumption, improve resident affordability, strengthen operating performance, and support sustainable-finance eligibility.

01

Manufactured Housing

  • Qualifying ENERGY STAR certified homes and HUD Code compliance
  • Licensed factory or authorized-channel procurement
  • Water and wastewater modernization
  • Leak detection and smart water management
  • Solar evaluated where feasible
02

Multifamily

  • Efficient windows, doors, roofing, insulation and air sealing
  • Efficient HVAC and LED lighting
  • Water-conserving fixtures
  • Efficient appliances and controls
  • LEED-informed renovation practices where appropriate
03

SRO / Motel Conversions

  • Adaptive reuse of existing buildings
  • Building-envelope, HVAC, lighting and water-efficiency upgrades
  • Mechanical and electrical improvements
  • Health, safety and life-safety upgrades
  • Solar and renewables evaluated where feasible

Not every property will receive every improvement. ENERGY STAR, LEED, solar, and other sustainability claims should be made only where applicable and documented.

10
Where Your Capital Sits

Capital Structure & Security

Where your capital sits in the stack — and the structural protections ahead of it.

Most senior · paid first
Senior Mortgage Debt
Actively retired — a paydown lowers portfolio LTV
You are here
Senior to equity
Proactive Sustainable BondsTM
9%–15% annual · paid quarterly · 100% principal returned at maturity
Subordinate · First-loss
Sponsor Equity
Absorbs losses first · paid last
Structural Protections
  • Priority repayment ahead of Sponsor equity — bondholders are paid before the Sponsor earns a dollar.
  • Cross-collateralized across 23 NOAH communities — no single asset can impair the bond.
  • <65% portfolio LTV, actively reduced as senior debt is retired.
  • DSCR 1.52 today, 3.25 stabilized — meaningful debt-service cushion.
  • Quarterly distributions from day one, with full return of principal at maturity.
Investors purchase interests in the Fund, not direct title to any individual property. The security interest, collateral, and enforcement mechanics are defined in the Fund's PPM, Operating Agreement, and subscription documents. Cross-collateralization and payment priority mitigate but do not eliminate the risk of loss.
09
Risk Architecture

What This Mitigates

A 9%–15% offering deserves a complete risk mitigation story.

Asset-level risk mitigation
What if a property underperforms?
  • Cross-collateralization across total portfolio — no single asset can sink the bond.
  • Current LTV: <65% portfolio-wide.
  • Current DSCR of 1.52, with stabilized pro-forma 3.25 — meaningful debt-service cushion.
  • Priority repayment ahead of Sponsor equity — you get paid first.
Market risk mitigation
What if the market turns?
  • 100% rent collection and uninterrupted distributions through the 2020–2021 COVID stress test.
  • NOAH demand resilience — the affordability gap widens in downturns, not narrows.
  • Sub-market rents with structural upside to market parity — rent floor, not rent ceiling.
Liquidity risk mitigation
What if I need liquidity?
  • Quarterly distributions paid at the start of each quarter — cash flow from day one.
  • 2-year minimum hold with a clearly defined return-of-capital date.
  • Secondary considerations reviewed case-by-case for qualifying investors.
08
Scale

Nationwide Portfolio Snapshot

25
Total Properties
1,012
Total Units
$26.5M
Total Assets Under Management
→  Click any pin on the map to see property details
14
Case Study In Progress

921 N Las Vegas Blvd, Las Vegas, NV 89101

43-unit SRO / workforce housing asset — shows the Proactive “How”: current rent → targeted capital → higher NOI → refinance capacity.

Asset
43 units
28 occupied / 65.1%
Current Rent
$31.55K/mo
On-rate today
Stabilized Rent
$48.35K/mo
At 100% occupancy
Sponsor
$750K
First-in capital
Value @ 6% Cap
$7.06M
$164K/door
Senior Debt
$3.33M net
$4.08M less sponsor
Financing Stack
Purchase price$4,080,000
Sponsor investment$750,000
Senior debt after sponsor$3,330,000
Proactive Bond capital$0 to date
Senior debt service$10K/mo through Jul 2027
Step-up if not refinanced$20K/mo Aug 2027
Post-Acquisition P&L Bridge
MetricCurrentStabilizedNotes
Monthly revenue$31,550$48,350adds $16.8K/mo
Operating expense @ 27%($8,519)($13,055)consistent slide assumption
Monthly NOI$23,032$35,296+$12.3K NOI/mo
Senior debt service$10,000$10K / $20Kuntil Jul 2027 / after
Cash flow before bonds$13,032$25.3K / $15.3Kavailable before bond interest
Debt coverage2.30x3.53x / 1.76xat $10K / $20K DS
Valuation at 6% Cap Rate
Stabilized revenue: $48,350/mo × 12 = $580,200 annual
Less 27% OpEx: $156,654
Stabilized NOI: $423,546
Value @ 6.00% cap: $7,059,100 · $164,165 per door
Current NOI / purchase price: 6.77% cap; stabilized yield on cost: 10.38%
How Investor Dollars Increase NOI
Targeted capital funds roof / repairs, room turns, lease-up and operations to activate remaining vacant units. The bridge is not speculative acquisition growth: it converts an owned asset from $31.55K/mo rent today to $48.35K/mo stabilized rent, creating ~$12.3K of additional monthly NOI before bond interest.
Impact + repayment: sponsor capital is already invested; no Proactive Bond capital has been deployed into this asset to date. New bond capital would be tied to measurable NOI expansion and refinancing capacity.
Formally acquired 7/7/2026; opening rent roll was $17,800/month and increased to $31,550/month in less than 60 days.
13
Performance

Demonstrated Track Record & Resilience

Consistent performance through unprecedented market volatility.

$26.5M
Affordable Housing Assets
Transacted in affordable housing assets.
$7.5M
Returned to Debt Investors
$7.5M returned to debt investors to date.
<65%
Portfolio LTV
Conservative leverage across the portfolio.

The COVID-19 Stress Test

During the 2020–2021 pandemic, our manufactured housing portfolio demonstrated remarkable recession resistance.

100%
Rent Collection
100%
Uninterrupted Distributions
07
Realized Performance

Investor Track Record

Actual realized and current results across every property, institutional, family office, and retail investment to date.

Investor Term Invested Capital Return MOIC Annualized
Properties
Hammonds MHCNov ’18–Aug ’22$1,270,000$5,200,0001.49x49.3%
Rancho Affordable LivingDec ’22–Jun ’25$800,000$2,500,0001.33x33.1%
Institutional Investors
Nautilus Funding LLPJan ’23–Jan ’26$5,650,000$6,864,7501.20x20.0%
Nautilus Funding LLPJan ’23–Jan ’24$5,145,000$6,174,0001.20x20.0%
Strike Eagle ConsultingOct ’22–Jun ’25$1,300,000$1,885,0001.17x17.2%
Family Office
Adamal SADec ’25–Jul ’26$150,000$191,5001.51x51.3%
Adamal SAApr ’24–Apr ’25$50,000$60,0001.20x20.0%
Sackley Family OfficeNov ’18–Aug ’22$1,265,000$1,872,2001.07x7.2%
Investor Term Invested Capital Return MOIC Annualized
Retail Investors
KW Real Estate Partners, LLCApr ’24–Apr ’25$50,000$58,5001.17x17.0%
J.K.Jul ’23–Aug ’24$50,000$67,5001.32x32.5%
J.M.May ’22–Aug ’22$17,500$21,0001.73x72.5%
S.C.Mar ’22–Aug ’22$22,000$29,7001.82x82.0%
M.Z.Feb ’22–Aug ’22$75,000$108,7501.90x90.2%
C.H.Jan ’22–Aug ’22$150,000$195,0001.49x48.5%
L.G.Sep ’21–Oct ’22$49,000$54,8801.10x10.2%
O.W.Jul ’21–Aug ’22$35,000$42,7351.19x18.7%
L.G.Apr ’21–Jul ’22$100,000$115,0001.12x11.7%
J.E.Jul ’20–Aug ’22$20,000$26,2501.15x15.3%
O.W.Jul ’20–Aug ’22$50,000$58,7501.08x8.4%
Past performance is not indicative of future results. Figures reflect realized and current investments to date; individual retail and family office investors shown by initials. Full investment track record available upon request. See our third-party due diligence report for further information.
12
Debt-based Return
Case Study

Hammonds MHC (Orangeburg, SC)

Hammonds MHC
Manufactured Housing Community
1

Acquisition · Nov 2018

$1.27 Million

A failing manufactured home park.

2

Value Creation

Dedicated infrastructure, renovations, and new homes — rehabilitation expense of +$685,000.

3

Exit · Aug 2022

$5.2 Million

Sold to a 100% affordable housing group (NYSE: UMH).

49.3% The result — delivered a 49.3% annualized debt-based return.
Past performance is not indicative of future results and does not guarantee future distributions, principal repayment, refinancing, collateral value, annualized returns, or liquidity. Historical investments may differ materially from this offering’s structure, collateral, leverage, investor terms, and risk profile.
12
Debt-based Return
Case Study

Rancho Affordable Living (Las Vegas, NV)

Rancho Affordable Living
Manufactured Housing / Multifamily Affordable Housing
1

Acquisition · Dec 2022

$800,000

An underperforming asset with below-market rents.

2

Value Creation

Rent growth, operational stabilization, and targeted capital improvements — rehabilitation expense of +$676,000.

3

Exit · June 2025

$2.5 Million

Strategic sale to a 100% affordable housing provider.

33.1% The result — delivered a 33.1% annualized debt-based return.
Past performance is not indicative of future results and does not guarantee future distributions, principal repayment, refinancing, collateral value, annualized returns, or liquidity. Historical investments may differ materially from this offering’s structure, collateral, leverage, investor terms, and risk profile.
12
Debt-based Return
Investor Testimony

Why Choose Proactive
Sustainable BondsTM?

Investor testimonial video
$1.3M
Debt Invested
2022–25
Realized Investor · Oct 2022–Jun 2025

"It has been remarkable to witness what Dr. Williams has done in… helping communities and providing above-average returns for investors…

I got my own family and network of friends involved in investing with Dr. Williams to help drive that model."

Russell Sage
Strike Eagle Consulting, LLC — Current Institutional Investor (2025), invested October 2022 to June 2025
10
Offering minimum $20K; Institutional allocations typically begin at $250K.
For Institutional Investors

Tiered, Impact-first, Fixed Income

2, 3, or 4 Year Sustainable Investment Bond Tiers. Overlapping tiers provide flexibility based on current-income needs versus deferred return preferences.

→  Click each tier above to see its terms, distribution schedule, and returns.
Tier One
$20K–$99K
Minimum investment
2 yearsHold duration
9%Interest / year
Illustrative Distribution Schedule · paid quarterly
Year 16%3% deferred
Year 26%3% deferred
End of Month 2426%+ full capital returned
Tier Two
$100K–$999K
Minimum investment
2 yearsHold duration
12%Interest / year
Illustrative Distribution Schedule · paid quarterly
Year 17%5% deferred
Year 27%5% deferred
End of Month 24210%+ full capital returned
Tier Three
$250K–$999K
Minimum investment
2 yearsHold duration
15%Interest / year
Illustrative Distribution Schedule · paid quarterly
Year 15%10% deferred
Year 25%10% deferred
End of Month 24220%+ full capital returned
Tier Four
$1M–$1.9M
Minimum investment
2–4 yrsHold duration1
15%Interest / year
Illustrative Distribution Schedule · paid quarterly
Year 110%5% deferred
Year 210%5% deferred
End of Month 24210%+ full capital returned
Tier Five
$2M+
Minimum investment
3 yearsHold duration
15%Interest / year
Illustrative Distribution Schedule · paid quarterly
Year 16%9% deferred
Year 28%7% deferred
Year 38%7% deferred
End of Month 36223%+ full capital returned

Note: Projected returns are net of fees and cumulative, not compounded. Distributions are paid quarterly, at the beginning of the quarter. All income is reported on a 1099.

1 Tier 4 carries a minimum 2-year hold.  2 Interest received with full return of initial capital investment.

Certain investment levels may qualify for multiple tiers based on the investor’s preferred balance of current quarterly income and deferred return.

08
Returns Comparison

Why this vs. your current options

Annual return potential vs. traditional fixed-income alternatives.

As of September 2026
Real Estate Debt Funds closest comparable
9%1
Mutual Funds long-term avg
10%2
Fixed Annuity
5.5%3
Treasury Bonds 10-year
4.7%4
2-Year CD
4.3%5
The Proactive Sustainable Bonds™ target reflects actual annual returns ranging from 9% to 15% depending on tier size. All investment involves risk of loss.
1. Private CRE debt funds: senior-loan strategies target 8–10% net IRR; the NCREIF/CREFC Open-End Debt Fund Aggregate has averaged ~7.4% annually since inception. Per Principal Asset Management, 2026.
2. S&P 500 index average annual return since 1928 (~10%), per Fidelity/SmartAsset historical analysis.
3. Average fixed (MYGA) annuity rate across 3–10 year terms from A-rated carriers, August 2026, per Annuity.org / American Annuity Calculator rate surveys.
4. Market yield on U.S. 10-Year Treasury Note, August 27, 2026, per FRED (Federal Reserve Bank of St. Louis), series DGS10.
5. Best nationally available 2-year CD APY, August 2026, per Bankrate / NerdWallet CD rate surveys.
11
In Their Words

Meet Our Residents

Our residents are the heart of Proactive Sustainable BondsTM.

Note: Testimonials are not representative of all investor experiences and are not guarantees of future performance.
06
Investment Strategy

Strategic Allocation Framework

Manufactured housing community
01

Manufactured Housing Communities (MHCs)

Acquire and stabilize affordable communities through infrastructure investment, occupancy growth, and placement of qualifying ENERGY STAR certified manufactured homes. The strategy includes water and wastewater modernization, leak detection and smart water management, and evaluation of solar or renewable-energy improvements where feasible.

Distressed multifamily housing
02

Distressed Multifamily Affordable Housing

Reposition underperforming affordable and NOAH assets through disciplined lease-up, operations, and sustainability-oriented renovation. Improvements may include energy-efficient windows and doors, roofing, insulation, HVAC, LED lighting, efficient appliances, water-conserving fixtures, smart controls, and LEED-informed renovation practices where appropriate.

SRO and workforce-housing residence interior
03

Single Room Occupancy (SRO) & Workforce Housing (Motels)

Preserve and activate underutilized SRO, extended-stay, and motel-conversion assets for affordable and workforce housing. Renovations may incorporate the same or similar sustainability upgrades used in multifamily properties, including building-envelope, HVAC, lighting, water-efficiency, mechanical, health and safety, and renewable-energy improvements where appropriate.
Images are representative of asset type.
14
Leadership & Governance

Experienced Stewards of Capital

Leadership
Management
Analysis
Impact Manager
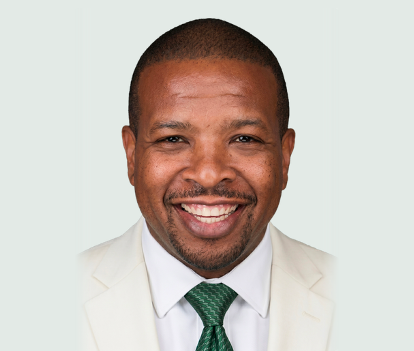
Dr. Canaan Van Williams
Founder & Managing Partner
25+ years in real estate investment. An industry leader in sourcing, revitalizing, and managing Class B and C value-add properties. Author of "Driving Social Impact Investment."
Let's Connect
Bob Totaro
Bob Totaro
Vice President of Sales
40+ years of successful investment experience across multiple financial products, with an extensive network of Broker-Dealers, RIAs, and Family Offices.
Tony Lawrence
Tony Lawrence
Director of Operations
Operations-focused leader managing investor relations, portfolio operations, and scalable systems that align financial returns with measurable outcomes.
Jesse Hollander
Jesse Hollander
Director
20+ years in financial services across private equity, venture capital, and mission-driven philanthropy, specializing in values-aligned fund structuring.
Alicia Galloway
Alicia Galloway
Impact & Operations Compliance Officer
15+ years working with high-net-worth investors, supporting the raise of tens of millions of dollars across multifamily real estate acquisitions.
Dr. Canaan Van Williams · Licensed retail manufactured-home procurement

Retail Manufactured Home Licensure — South Carolina & Ohio. Subject to applicable state licensing and transaction requirements, this capability supports direct manufacturer or authorized factory-channel procurement of qualifying ENERGY STAR certified manufactured homes for Fund-owned communities. The strategy is intended to reduce acquisition basis, strengthen cost control, standardize energy-efficient specifications, and support competitive rents and more attainable resident home-purchase pricing.

15
Frequently Asked

Honest answers to common questions

Minimum, term & liquidity?
Minimums vary by investor type and selected tier. Eligible accredited investors may participate beginning at $20,000; institutional allocations typically begin at $250,000. Terms range from 2–4 years.
What if a property underperforms?
Returns are cross-collateralized across total portfolio with priority repayment ahead of sponsor equity. Current LTV: <65%. Current DSCR: 1.52, stabilized 3.25.
How does this perform in a recession?
Through 2020–2021 our manufactured-housing portfolio delivered 100% rent collection and 100% uninterrupted distributions — affordable housing is structurally recession-resilient.
Do I receive Schedule K-1 or Form 1099?
All distributions are reported annually on Form 1099. Consult your tax advisor for treatment specific to your situation.
What's the sponsor's track record?
25+ years across 14 community transformations. The platform's impact and responsible-investment credentials include Morningstar Sustainalytics, BlueMark, Impact Evaluation Lab, and PRI signatory status, as applicable to the Fund's impact, sustainability, and responsible-investment framework. Historical financial performance is separately presented and is not guaranteed to recur.
Can I redeem early?
Bonds are illiquid by design (2–4 year terms). Early redemption is at the issuer's discretion under the PPM. Please review the PPM for full terms.
Full investor FAQ →
18
Get Started

Your next 3 steps

A simple, transparent path from interest to investment.

1

Schedule a 30-min call

Meet with Dr. Canaan Van Williams to discuss the offering structure, tiers, portfolio strategy, sustainable finance, and due-diligence materials.

Schedule a 30-minute call →
2

Review the PPM & data room

Diligence on your timeline. PPM, audited financials, current portfolio detail, and verified impact reports.

Access data room →
3

Wire funds & receive your bonds

Sign the subscription documents, wire your allocation, and begin receiving steady quarterly distributions in the following quarter.

Rule 506(c) · Institutional & accredited investors only

19
The Opportunity

More Than Returns

Proactive Sustainable BondsTM offer more than returns — they represent a commitment to creating a better world while improving your financial future.

KEY HIGHLIGHTS
  • $175M targeted raise for real estate asset-backed NOAH properties
  • Up to 30%, 45%, or 60% total returns with <65% leverage
  • Third-party reviewed impact and sustainability framework; current income, property stabilization, sustainable improvements, and a refinance pathway for potential return of investor principal.
A conversation about the offering

Schedule a 30-minute call

Discuss the investment tiers, portfolio strategy, sustainable-finance positioning, and due-diligence materials with Dr. Canaan Van Williams.

Schedule a 30-minute call →
Schedule a 30-min call tenthavenue.io/book/canaan Click to book a time →
20
Thank You
Schedule a 30-minute call with Dr. Canaan Van Williams →
www.sustainablebonds.com
invest@sustainablebonds.com  ·  +1 (206) 686-9293
Scan to Revisit
offering.sustainablebonds.com